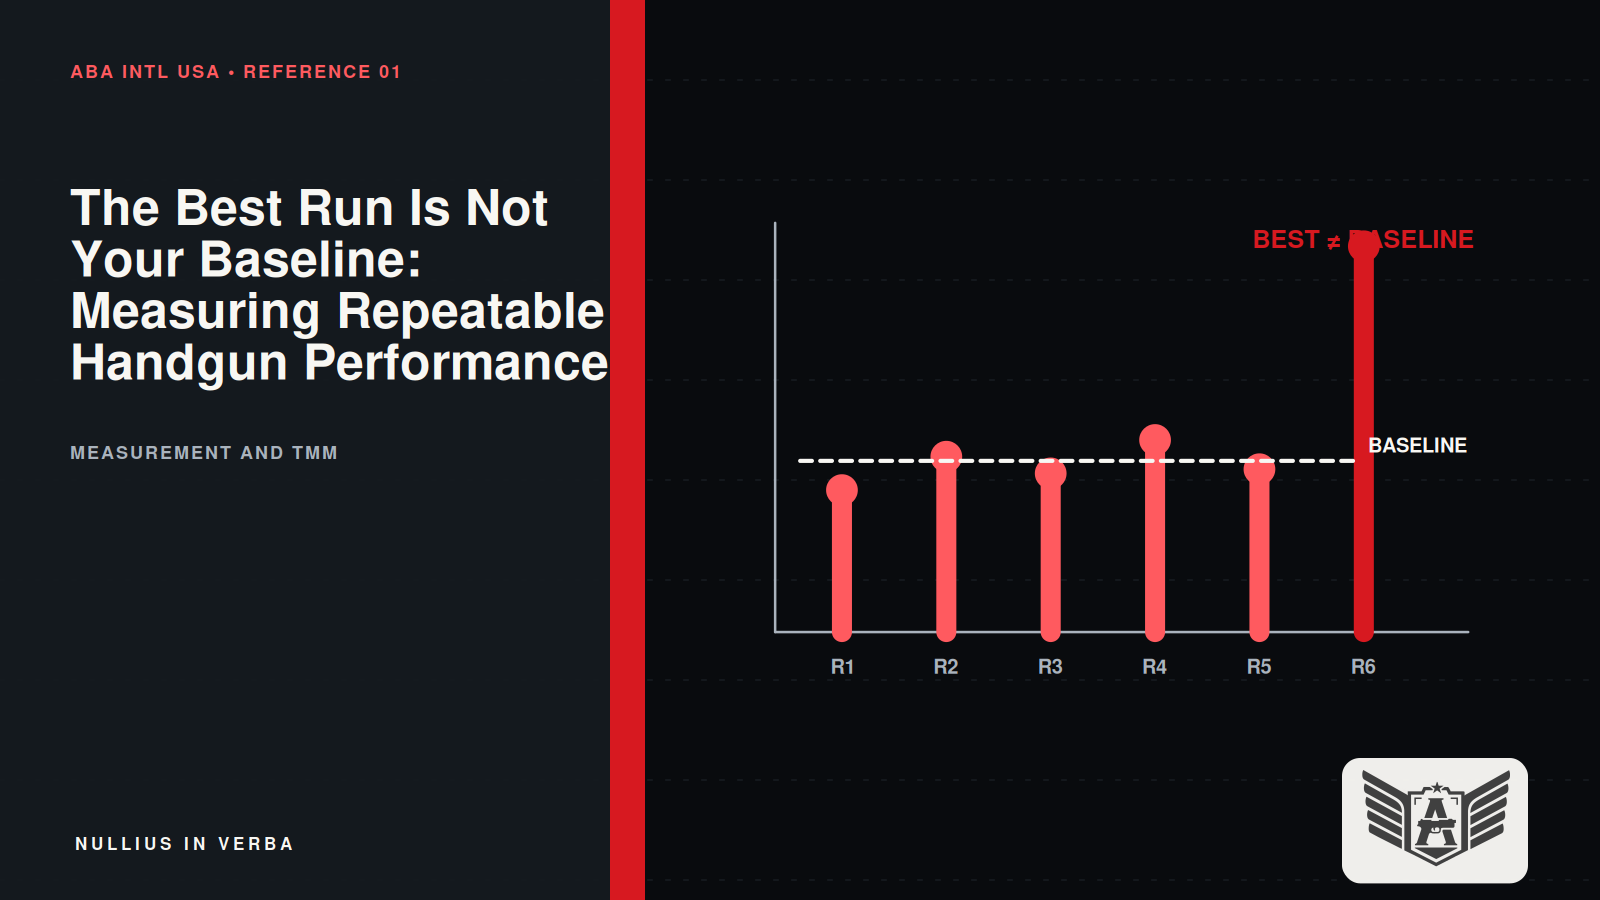

Firearms training often compresses a complex performance into one
number: “My draw is 1.5.” The sentence sounds precise but leaves nearly
every important question unanswered. Was 1.5 the fastest attempt, the
average, or a hand-timed estimate? How many repetitions were recorded?
What target and distance defined success? Were misses deleted? Did the
series cluster tightly around 1.5, or did it swing between 1.2 and 2.0?
Without those details, the number functions more as identity than
measurement. A better language begins with three compact
descriptors—average, spread, and valid rate—reported together and
supported by the raw attempts.
These metrics answer different questions. The average estimates the
center of observed performance. The spread describes how far the
observations move around that center. The valid rate preserves the
relationship between time and the required outcome. None is sufficient
by itself. A fast average can conceal unacceptable shots; a narrow
spread can describe consistently poor execution; a high valid rate can
be achieved by moving so slowly that the test stops challenging the
capability of interest. The metrics become useful when interpreted as a
profile rather than ranked as independent trophies.
Consider a five-run concealed-draw series recorded as 1.31, 1.47,
1.52, 1.60, and 1.78 seconds. Suppose the 1.31-second attempt missed the
predetermined scoring zone while the other four were valid. The mean
across every attempt is 1.54 seconds. The valid-only mean is 1.59
seconds. The full observed range is 0.47 seconds, while the valid-only
range is 0.31 seconds. The valid rate is 80 percent. Each statement is
true, but each describes a different property of the same session.
The all-attempt average preserves the temporal behavior of the entire
series, including the invalid attempt. This makes it useful for
describing how quickly the performer moved under the test instruction.
The valid-only average answers a narrower question: how quickly were
successful attempts completed? Reporting only the valid-only number can
be misleading if invalid attempts were substantially faster, because it
hides evidence that the performer’s current speed strategy sometimes
outruns control. Reporting only the all-attempt number can also mislead
if the reader assumes that every time represents an acceptable hit. The
clean solution is to label both whenever invalid attempts occur.
The arithmetic mean is not automatically the best summary for every
small sample. In the example, the median time is 1.52 seconds, which is
lower than the 1.54-second all-attempt mean because the slower
1.78-second observation pulls the average upward. With only five trials,
the raw values remain more informative than any single statistic. The
mean should therefore be treated as a compact description, not an
eraser. If the mean, median, and visual pattern tell different stories,
the discrepancy is not an inconvenience to remove; it is a reason to
inspect the performance process more closely.
Spread is where inconsistency becomes visible. The range is
calculated as the slowest attempt minus the fastest. Its simplicity
makes it useful for field records, but it is sensitive to a single
extreme and grows mechanically as more trials are collected. Standard
deviation expresses dispersion around the mean and becomes preferable
for longer series, while the coefficient of variation expresses standard
deviation relative to the mean. Hopkins (2000) notes that reliability
analysis in sports performance must account for within-subject variation
and measurement error rather than treating every score difference as
real change. A five-run scorecard need not become a statistics seminar,
but it should never conceal the raw distribution behind one decimal.
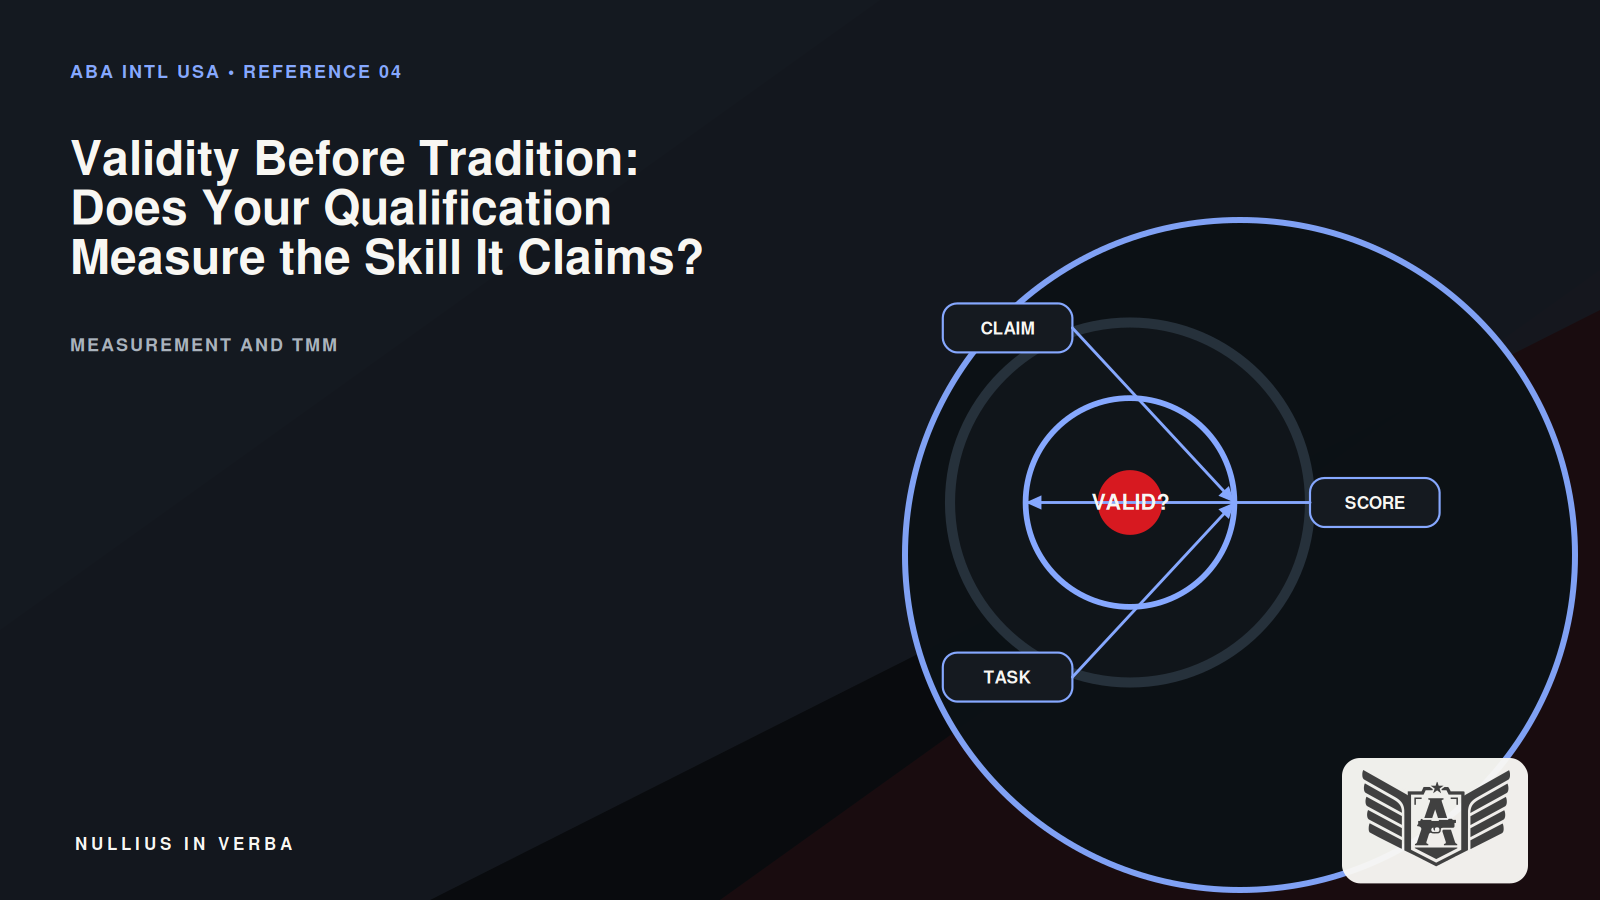
Validity begins before the timer sounds. The scoring zone, distance,
start condition, required visual or decision standard, and rules for
procedural errors must be defined in advance. If the acceptable target
area changes after the shot, the valid rate becomes a negotiated
outcome. A target standard should be demanding enough to represent the
intended task but stable enough to permit longitudinal comparison.
Fitts’s law is relevant here because movement time varies with target
width and movement amplitude; a time detached from target difficulty
cannot be interpreted as an invariant property of the shooter (Fitts,
1954).
The valid rate is calculated by dividing acceptable attempts by total
attempts. Four valid trials in five produce 80 percent; eighteen in
twenty produce 90 percent. The denominator must include every scored
attempt initiated under the protocol. “Mulligans,” timer problems,
equipment malfunctions, and genuine procedural errors should be coded
rather than silently removed. Some exclusions may be justified—for
example, a verified timer failure—but the reason and rule must be
transparent. A dataset improves when anomalies are classified, not when
inconvenient outcomes vanish.
Accuracy should also be represented with enough resolution for the
training question. A binary valid-invalid rule is robust and easy to
apply, but it can treat a center hit and a marginal hit as equivalent. A
more detailed score can reveal changes in precision, yet added
categories increase evaluator demands and may create false precision.
Morrow et al. (2011/2014) distinguish reliability from validity for
precisely this reason: a complex score is not automatically a better
measure. The scoring architecture should be the simplest system that
preserves the distinctions needed for the decision that follows.
The relationship among the three metrics is more important than any
isolated threshold. If average time improves, spread narrows, and valid
rate remains stable or rises, the direction of change is easy to defend.
If average time improves while spread widens and valid rate falls, the
performer may be exploring a faster boundary or may be losing control;
the training interpretation depends on whether that exploration was
intentional. If the average remains stable while spread narrows, the
system may be consolidating. If validity rises while time slows, the
performer may be recalibrating accuracy before rebuilding speed.
This profile also prevents simplistic comparisons between people. A
novice’s 1.70-second average with a 0.15-second spread and 100 percent
valid rate may represent a stable foundation. An experienced shooter’s
1.45-second average with a 0.60-second spread and 60 percent validity
may contain greater maximum speed but less dependable performance.
Declaring one “better” without reference to task requirements is not
analysis. Metrics describe; standards and context evaluate. A patrol
officer, armed citizen, competitor, and instructor demonstration may
require different validity criteria even when the motor act appears
similar.
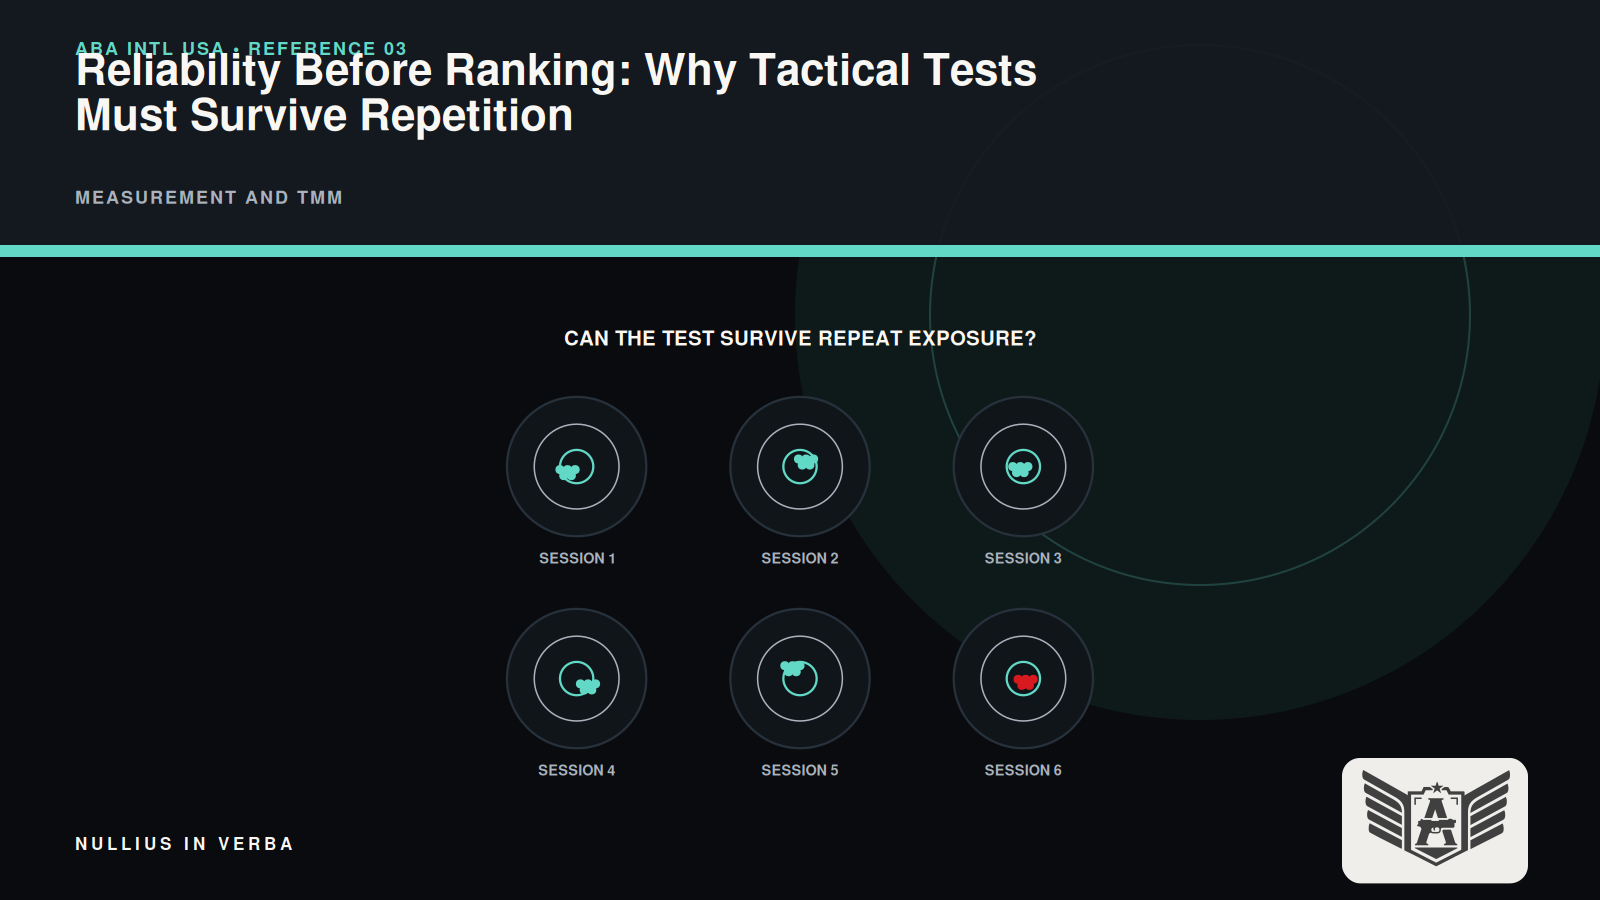
Sample size changes what can be inferred. Five attempts are efficient
for a recurring individual baseline, but they provide an unstable
estimate of rare failures. A performer who is truly valid 90 percent of
the time can easily produce a five-run set that appears perfect or
mediocre by chance. Longer series improve the estimate but also
introduce fatigue, adaptation, and ammunition cost. The solution is not
to pretend that five is statistically complete. It is to use a compact
protocol frequently, preserve the longitudinal record, and periodically
run a larger validation set when the decision warrants it.
Session conditions should be recorded because they can shift all
three metrics. Equipment configuration, concealment garment, target
distance, lighting, physical exertion, warm-up, and instruction
influence the observed result. A 0.12-second change obtained after
switching holsters is not automatically a training effect. The system
changed. The TMM Triad treats equipment and context as part of technique
expression, measurement as the means of detecting the consequence, and
method as the intervention selected after diagnosis (Bearare &
Silveira, 2026). The record should make those links auditable.
Instructors can use the metrics to order corrections. A wide spread
usually justifies investigating inconsistent access, grip acquisition,
path, visual confirmation, or start behavior before prescribing
generalized speed work. A low valid rate with tight times may point
toward a repeatable but miscalibrated strategy. A high valid rate with
slow, tightly grouped times may indicate unused speed capacity, but the
method should increase functional difficulty gradually rather than
demand an arbitrary personal-record pace. The metric profile narrows the
hypothesis; video and observation test it.
Retesting must use the same definitions. If a valid hit meant a
particular scoring zone in week one, it cannot become a larger zone in
week four. If invalid attempts were included in the denominator
initially, they must remain there. Bland and Altman’s (1986) work on
agreement is a reminder that measurement systems must be examined for
how closely repeated observations behave, not merely whether they move
in the same general direction. A trend line built from changing rules is
not evidence of improvement; it is evidence of changing measurement.
ABA Intl’s practical position is deliberately modest. Average,
spread, and valid rate do not explain every performance outcome, and a
five-run test does not recreate a fight. They do, however, force the
performer to preserve the session’s central behavior, inconsistency, and
success probability in one visible record. This is a major improvement
over the culture of posting only the fastest valid-looking clip. The
scorecard creates a question that training can answer: which part of
this profile should change next, and what method is most likely to
change it?
The language of a serious baseline should therefore sound different.
Instead of “my draw is 1.5,” report: “Across five concealed attempts at
the defined target, my all-attempt mean was 1.54 seconds, my valid-only
mean was 1.59, my observed spread was 0.47, and my valid rate was 80
percent.” That statement is longer because reality is longer. It gives
the instructor enough information to challenge the conclusion, reproduce
the task, and decide what to train. Precision is not the number of
digits on the timer; it is the clarity of the claim supported by the
data.
References
Bearare, S. C., & Silveira, L. (2026). Technique-Method-Metric
Triad in firearms training under extreme stress. RECIMA21 – Revista
Científica Multidisciplinar, 7(7), e778536.
https://doi.org/10.47820/recima21.v7i7.8536
Bland, J. M., & Altman, D. G. (1986). Statistical methods for
assessing agreement between two methods of clinical measurement. The
Lancet, 1(8476), 307–310.
https://doi.org/10.1016/S0140-6736(86)90837-8
Fitts, P. M. (1954). The information capacity of the human motor
system in controlling the amplitude of movement. Journal of
Experimental Psychology, 47(6), 381–391.
https://doi.org/10.1037/h0055392
Hopkins, W. G. (2000). Measures of reliability in sports medicine and
science. Sports Medicine, 30(1), 1–15.
https://doi.org/10.2165/00007256-200030010-00001
Morrow, J. R., Jr., Jackson, A. W., Disch, J. G., & Mood, D. P.
(2011). Measurement and evaluation in human performance (4th
ed.). Human Kinetics. [Portuguese edition: Artmed, 2014.]

TRAIN. MEASURE. EQUIP.
Continue learning through ABA research and training. When equipment is the next variable, go directly to the ABA Store.
GET THE EQUIPMENT →Continue from research to practice
Knowledge is useful when it changes what you do next.
Establish a baseline, locate the limiting factor and measure whether training produced a real change.
Ask about ABA | Performance